


Descriptive Statistics is an essential branch of statistics that focuses on summarizing and organizing data in order to provide a clear and concise understanding of their fundamental characteristics. While Inferential Statistics seeks to make statements about the population based on a sample, Descriptive Statistics is concerned with examining and communicating the intrinsic characteristics of the data itself.

Descriptive Statistics
The core of Descriptive Statistics is measures and techniques that summarize and organize data in a meaningful way. Some of the key measures include:
Centrality Measures:
- Mean: The arithmetic mean provides an estimate of the central value of a data set by calculating the sum of all values and dividing by the number of observations.
- Median: The median represents the central value of a set of ordered data. It is less sensitive to outliers than the average.


IN-DEPTH ARTICLE
Dispersion Measurements:
- Standard Deviation: Standard deviation measures the dispersion of data around the mean. Higher values indicate greater variability.
- Interquartile Range (IQR): The IQR represents the range between the first and third quartiles of the data, offering a robust measure of variability.


IN-DEPTH ARTICLE
- Visualization Techniques:
- Histograms: Histograms show the frequency distribution of your data, highlighting how often specific intervals occur.
- Bar Chart: Bar charts are used to represent the frequency distribution of categorical data.
- Distribution Shape Measurements:
- Skewness: Skewness measures the skewness of a distribution. Positive values indicate a longer right tail, while negative values indicate a longer left tail.
- Kurtosis: Kurtosis measures the “heaviness” of the tails of a distribution. Higher values indicate thicker tails and a more pronounced peak.
Advanced Techniques:
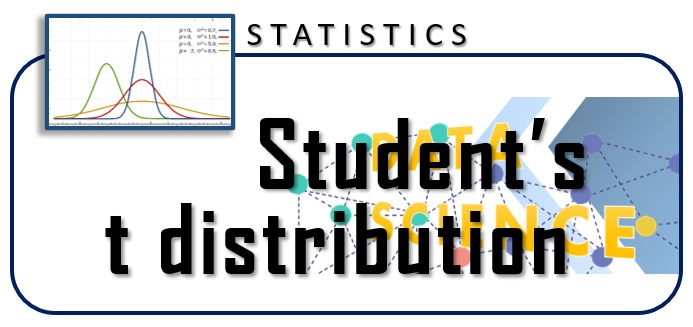
Student’s T-distribution: The Student’s T-distribution is often used when the sample size is small and the population variance is unknown. It appears as a bell-shaped distribution similar to the normal one but with heavier tails.

IN-DEPTH ARTICLE
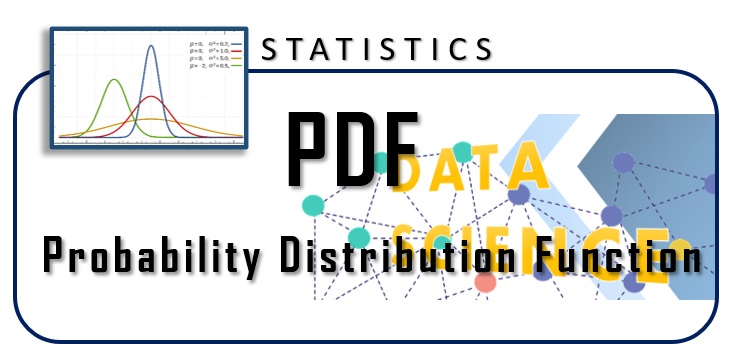
Probability Density Function (PDF): The PDF describes the probability that a random variable falls within a given interval. It is critical to understanding the shape of a probability distribution.

IN-DEPTH ARTICLE
Probability Mass Function (PMF): PMF provides the probability distribution of a discrete random variable. It is a function that associates with each value of a discrete random variable the probability that the variable takes on that particular value. In other words


IN-DEPTH ARTICLE
Cumulative Distribution Function (CDF): The CDF provides the probability that a random variable is less than or equal to a specific value. It is useful for calculating cumulative probabilities.
A Deep Dive into the Details: The Power of Descriptive Measures
Descriptive Statistics plays a fundamental role in the interpretation and communication of data. These measures provide a clear and accessible picture of the main characteristics of a data set, allowing you to identify patterns, anomalies and trends.
Descriptive measures are essential tools for exploring and understanding the structure of data.
Skewness, for example, quantifies the symmetry of a distribution, indicating whether the tail is more shifted towards higher or lower values than the mean. Significant skewness may suggest the presence of asymmetries that affect the representativeness of central tendency statistics, such as the mean.


IN-DEPTH ARTICLE
Kurtosis on the other hand, reflects the shape of the tails of a distribution. Distributions with high kurtosis have heavier tails, while low kurtosis indicates lighter tails. This measure is crucial for assessing the risk of extreme values or outliers.


IN-DEPTH ARTICLE
Standard deviation, a measure of dispersion, reflects how much the data deviates from the mean. A larger standard deviation indicates greater variability, while a smaller one indicates greater cohesion of the data around the mean. This information is fundamental to interpret the reliability of the forecasts and the stability of the models.
In summary, these measures offer a detailed overview of the structure and characteristics of the data, allowing analysts to make informed choices when selecting models, managing outliers and understanding data variability. Insight into descriptive measures is essential to reveal subtle details hidden in data and provide a solid foundation for analyzing and interpreting information.
Conclusions: Illuminating the Path through Numbers
In conclusion, Descriptive Statistics is the beacon that lights the path through the vast sea of data. Through measures of centrality, dispersion and visualization techniques, it offers an in-depth look at the nature of the data itself. Its practical application is ubiquitous and its importance in understanding data is immeasurable.
Our journey in Descriptive Statistics has just begun. In the next sections of this exploration, we will delve deeper into each measure and technique, examining case studies and real-world applications to gain a deeper understanding of how this discipline can shape the way we interpret and use data.