It is a new open-source JavaScript library for creating interactive maps. It is developed by Vladimir Agafonkin. It is quickly gaining popularity.
Embedding Leaflet in the web page
Before writing any code for the map, you need to do the following preparation steps on your page. First you need to incluse the Leaflet.js library with its CSS file in thesection of the web page.
If you want to use a CDN service (the webpage loads the library directly from a remote service without downloading the library files locally) you need to write this:
<link rel="stylesheet" href="http://cdn.leafletjs.com/leaflet-0.7.2/leaflet.css" />
<script type="text/javascript" src="http://cdn.leafletjs.com/leaflet-0.7.2/leaflet.js">
</script>
instead if you have already downloaded the library on your web server you can include the file by writing directly their relative path (relative to the .html file). For example, if we hold all the JavaScript libraries in the plugins directory, i have to write this:
<link rel="stylesheet" href="plugins/leaflet.css" />
<script type="text/javascript" src="plugins/leaflet.js"></script>
The next step is to embed an interactive map in the web page’s content. Thus, you need to create a place to put it exactly where you want the map be shown. Thus, in the section of your HTML page, put the following tags.
<div class="map-wrap">
  <div id="map"></div>
</div>
Since you have just defined the map and its container, you need to add some attributes such as their size. This could be done by setting them in CSS. So we add to thesection of the HTML page the following lines.
<style>
.map-wrap {
   border: 3px solid #000;
   width: 400px;
   height: 400px;
}
#map {
   width: 400px;
   height: 400px;
}
</style>
The tilesets
There are some different tilesets available online. In this article we will cover the most common:
- The openStreetMap (OSM)
- The MapQuest-OSM tiles
- The MapQuest Open Aerial tiles
- The Google Map
Using the OpenStreetmap (OSM) Tiles
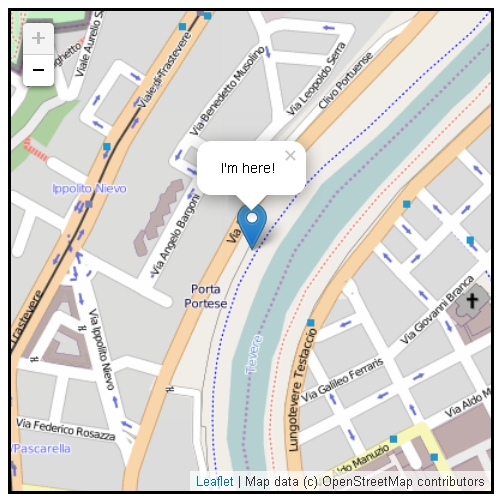
Now it’s the time to start coding in JavaScript. As a geographic example we will choose the center of Rome, but you can use any other portion of the world map at your choice. The rules applied here, can be independently used for any kind of map.
Let’s start defining a map object.
var map = new L.Map('map');For this first example we have choose to use the OpenStreetMap (OSM). In fact, it is the most commonly used type of tile. For using it, you need only to add its URL defining:
var url = 'http://{s}.tile.openstreetmap.org/{z}/{x}/{y}.png';Then, you add the terms of use, that is a special text string which reports the attribution of the tile. In the case of OpenStreetMap we can add
var attrib = 'Map data (c)OpenStreetMap contributors';
And finally you need to define the Tile layer on which will be represented the map.
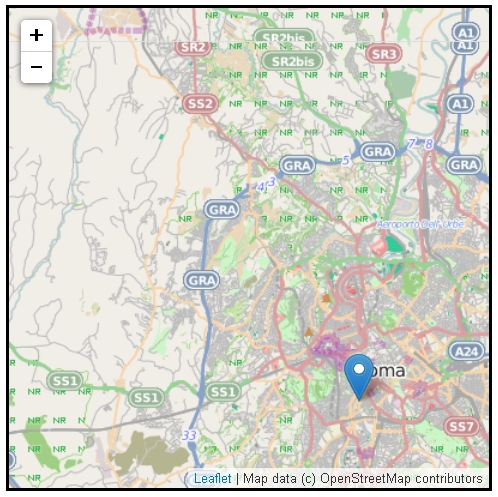
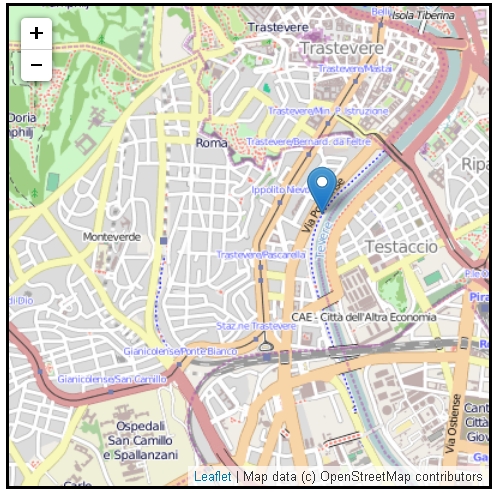
var osm = new L.TileLayer(url, {minZoom: 8, maxZoom: 16, attribution: attrib});Here we have specified the minimum and maximum value of zooming. This is very important if we want the user see a map consistent with the information represented. In fact, the data or marker representation normally has a meaning at a specific level of zooming, if the user zoom in or zoom out over a certain range the map could be appear meaningless.
Once you have defined the tile layer, it is time to draw it.
map.setView(new L.LatLng(41.88,12.47),16);
map.addLayer(osm);
Now that you also have a map, you need to add the point that you want to highlight upon it. We do this by placing a marker at a specific point (defined by the longitude and latitude values). Furthermore we want a text shows the marker indication, and therefore we add to the marker a popup.
L.marker([41.88,12.47]).addTo(map).bindPopup("I’m here!").openPopup();Ok. After all this work you can load the page, and finally see your results!!!
In the top-left corner a zooming control is showed. Clicking on it or using the mouse wheel the user can vary the zooming level. Keeping pressed the mouse button and moving the mouse, the user can move the map.

Using the MapQuest-OSM tiles
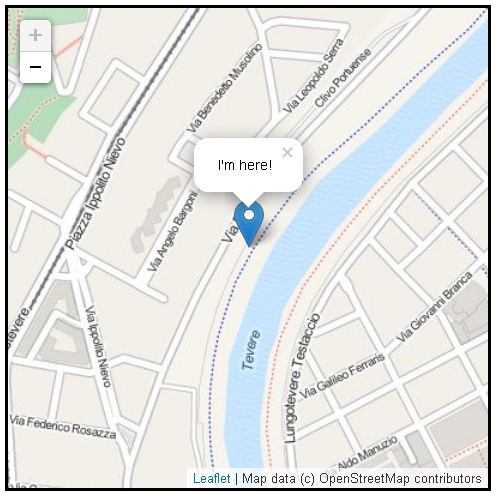
If we want to use the MapQuest-OSM tiles we need to replace the previous url with this new one:
var url = 'http://otile4.mqcdn.com/tiles/1.0.0/osm/{z}/{x}/{y}.png';Using the MapQuest Open Aerial tiles
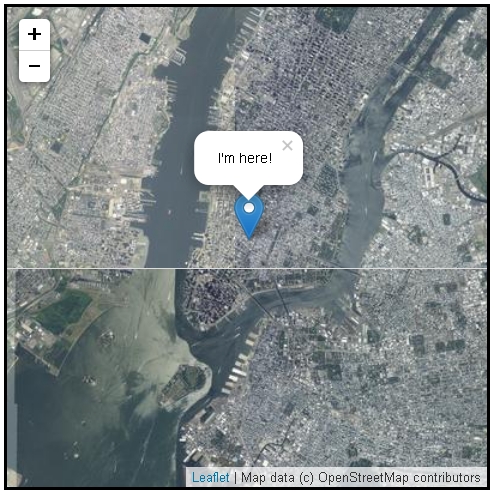
MapQuest provides us with a set satellite maps. Unfortunately, only some levels of zooming are available for Italy. Thus to show the potential of this type of maps, I chose to show New York city.
map.setView(new L.LatLng(40.72,-74.00),12);
and using the following url:
var url = 'http://otile4.mqcdn.com/tiles/1.0.0/sat/{z}/{x}/{y}.png';Using the Google Map tiles
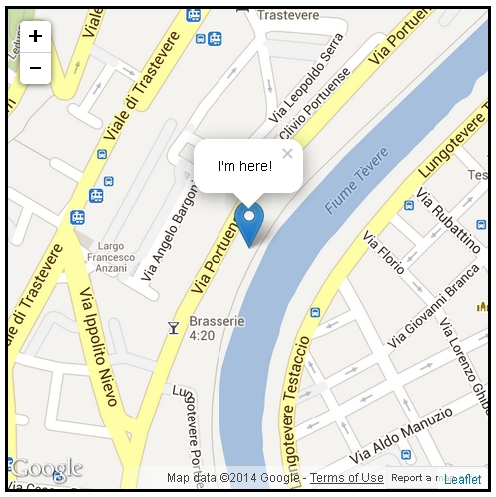
Instead if it is Google Map the tile layer you want, you need to replace the JavaScript code with the following:
var map = new L.Map('map');
var googleLayer = new L.Google('ROADMAP');
map.setView(new L.LatLng(41.88, 12.47),16);
map.addLayer(googleLayer);
L.marker([41.88,12.47]).addTo(map).bindPopup("I’m here!").openPopup();
Don’t forget to add the following CSS settings to the web page, else you will not see any marker in your map.
.leaflet-map-pane {
   z-index: 2 !important;
}
.leaflet-google-layer{
   z-index: 1 !important;
}
Markers, circles and polygons
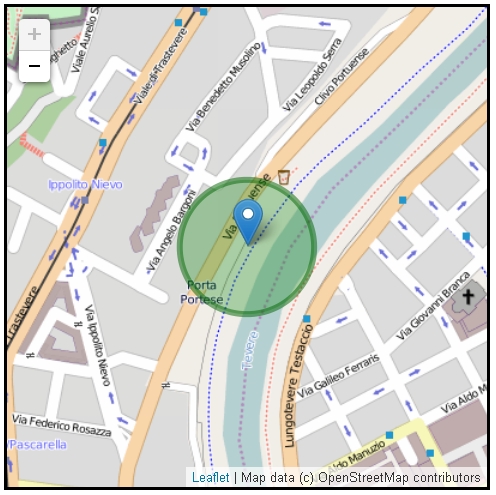
Besides markers and popups, you can easily add other things to your map such as polylines, polygons and circles. For example, you can consider the case of adding a circle to the map if you need to highlight a specific area.
L.circle([41.88,12.47],100, {
color : 'darkgreen',
fillColor: 'green',
fillOpacity: 0.3
}).addTo(map);
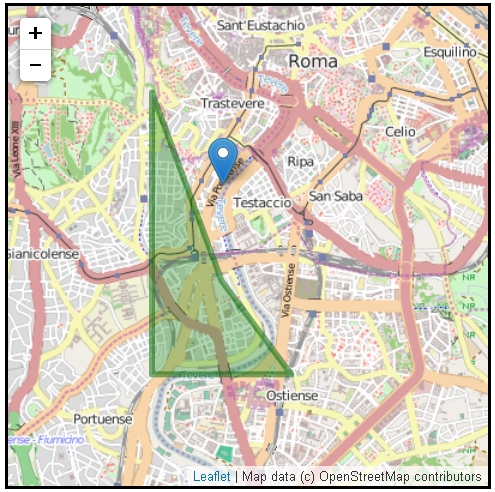
Instead, if the area is not circular but more complicated you need to use a polygon for highlighting that area.
L.polygon([[41.89,12.46],[41.86,12.46],[41.86,12.48],[41.87,12.47]],
{
  color : 'darkgreen',
  fillColor: 'green',
  fillOpacity: 0.3
}).addTo(map);
Further work on popups
You have already seen how to assign a popup to a marker, but, of course, you can’t imagine how many things are possible to do with them. In fact, the text passed as argument to the bindPopup() function actually is not a simple string but it is an HTML text. So it is possible to use the HTML tags to improve the appearance of the popup!
For example, it is possible to add an image along with the text (here you can download the icon from OpenIcon gallery and rename it icon.png). Replace the code with the marker with these new lines.
L.marker([41.88,12.47]).addTo(map).bindPopup("<img alt="" src="icon.png" /><b>HI!!</b>
This is me!");
L.marker([41.882,12.47]).addTo(map).bindPopup("<i>Someone else</i>");
L.marker([41.881,12.471]).addTo(map).bindPopup("<i>Someone else</i>");
L.marker([41.879,12.469]).addTo(map).bindPopup("<i>Someone else</i>");
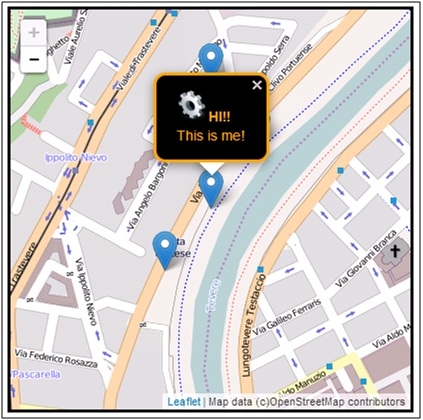
Loading again the page the map shows four markers. Only clicking on the correct one you get the popup with the gear icon. Remember that the map can show only a popup at a time!
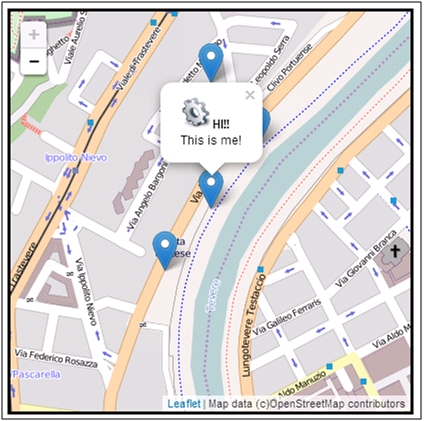
That’s not all! You can further modify the appearance of the popup acting at the level of CSS styles. For example, adding the following CSS style settings.
.leaflet-popup-content-wrapper {
   background: #000;
   border: solid 3px orange;
   color: orange;
   font-size: 14;
}
you get a differently colored popup
Using customized markers
Unfortunately, the Leaflet library comes with only one type of marker. If you want to replace its icon with another one you need to create it by yourself. To make a custom icon, you usually need two images, the actual icon image and the image of its shadow.
For this example you will use the “green leaves” icon along with its shadow. Here to download the green, red, yellow icon and the shadow used in the leaflet site tutorial.
var greenIcon = L.icon({
   iconUrl: 'leaf-green.png',
   shadowUrl: 'leaf-shadow.png',
   iconSize:     [38, 95], //size of the icon
   shadowSize:   [50, 64], //size of the shadow
   iconAnchor:   [22, 94], //point of the icon which will correspond to marker's location
   shadowAnchor: [4, 62],  //the same for the shadow
   popupAnchor:  [-3, -76] //point from which the popup should open relative to the iconAnchor
});
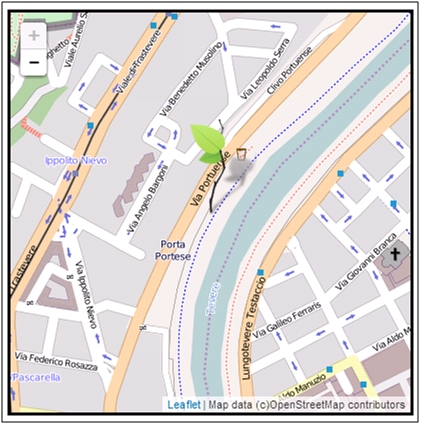
Once defined a set of markers, it is possible to choose a different icon for the markers put on the map. In this case, we have defined only one icon only to understand how to define and use them.
L.marker([41.88,12.47],{icon:greenIcon}).addTo(map);With this last example, I finished the article on the interactive maps. See you at the next article. Bye[:]

